I have been building with MeteorJS for the last 7 years, and in my experience, monitoring applications in production has always been one of the most critical parts of owning a product. Monitoring for an application may sound like checking a dashboard once in a while, but real production systems demand much more attention. I have seen apps run perfectly in staging and still fail in production within hours due to a lack of visibility.
What exactly does Monitoring & Alerting mean
At its core, monitoring and alerting are about protecting user experience and business outcomes through constantly being on top of your application performance. The goal is to detect issues before users complain, before revenue drops, or before the system collapses.
Monitoring: the practice of collecting and analysing metrics, logs, and system signals to understand application health
Alerting: the mechanism that notifies you when something goes wrong based on defined conditions
Just like the saying “An apple a day keeps the doctor away”, in software engineering, I like to say, it’s “Monitoring and Alerting at play, keeps unknown issues at bay”.
Why Monitoring Feels Different in Meteor Apps
Meteor apps behave differently compared to traditional backend systems. It handles real-time data, persistent connections, and reactive UI updates. This makes failures harder to detect through simple logs.
Meteor uses DDP connections instead of standard stateless HTTP calls. That means issues can exist even when APIs look fine.
A few common production realities:
- Subscriptions silently fail without obvious errors.
- Memory usage grows due to long-lived connections.
- CPU spikes during reactive updates
- Client and server state drift out of sync.
Monitoring in Meteor needs to cover both real-time behaviour and system stability.
Where Monitoring and Alerting Actually Help
Here are some of the benefits of monitoring and alerting in software engineering:
- Faster issue detection: In early startup days, without monitoring, users reported bugs before we knew anything broke. With monitoring in place, alerts fire within minutes and reduce chaos.
- Better user experience: You fix issues before users face them, and less frustration leads to better retention
- Protection of business metrics: Downtime affects revenue directly, so monitoring ensures uptime stays within acceptable limits
- Automated incident response: Systems can restart services or scale automatically when thresholds are crossed.
What Should You Monitor in a Meteor App
Monitoring Meteor apps is about covering three layers: application, system, and user impact.
1. System Level Signals
Meteor runs on Node.js, so system health plays a big role.
- CPU usage
Spikes often correlate with reactive recomputations. - Memory usage
Meteor apps can leak memory if subscriptions are not cleaned up. - Disk and network I/O
Important for apps with heavy database operations - Container or VM health
If you run on Docker or cloud instances, track resource limits
2. Application Level Signals
These are closest to your Meteor codebase.
- Method call rate and failure count:
Track how often Meteor methods are called and how many fail - DDP connection & Subscription readiness
High or dropping connections signal real-time instability. Slow subscriptions indicate backend or database issues. - Error logs
Capture exceptions from both server and client.
3. User Impact Metrics
These are the most important metrics because they reflect real user experience.
- Page load time
Slow loads indicate frontend or backend issues. - Error rate from the client
Frontend errors often go unnoticed without monitoring. - Session drop rate
Frequent disconnects indicate DDP instability.
Choosing the Right Tools for Meteor Monitoring
Meteor does not enforce a specific monitoring stack, so you have flexibility.
Here are some commonly used tools:
- Galaxy Cloud
The official Galaxy Cloud infrastructure provides a variety of toolchains for monitoring Meteor applications. - Monti APM
Historically popular for Meteor-specific insights, like publications and subscriptions - Sentry
Great for collecting modern metrics from Node.js apps - DataDog
All-in-one solution with metrics, logs, and alerting
You can combine Meteor-specific tools with general-purpose monitoring systems for better coverage.
Setting up monitoring & alerts in our Meteor applications
Using Galaxy’s Observability Toolsets
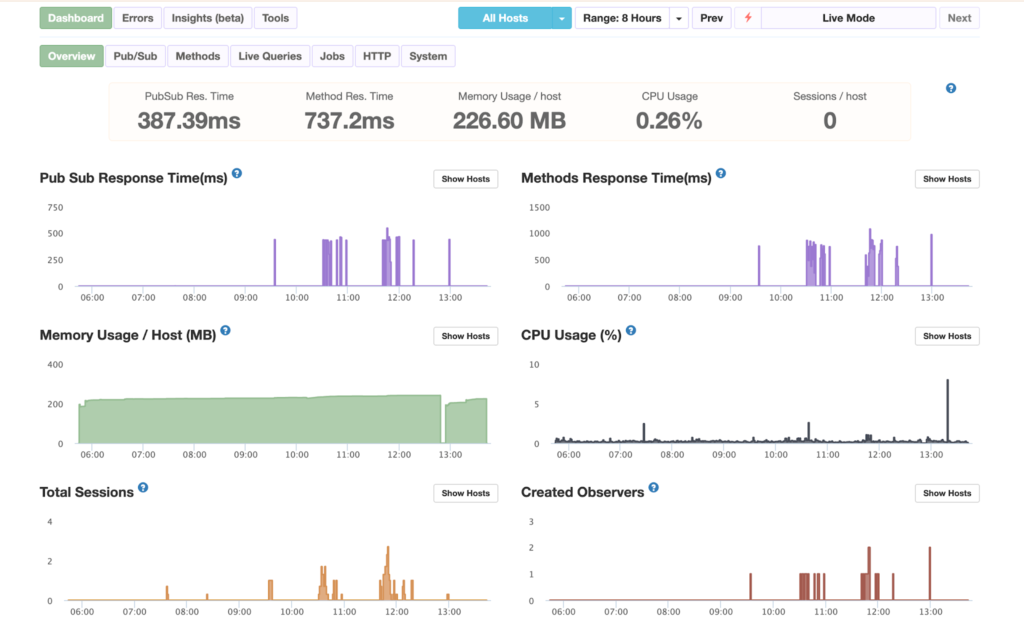
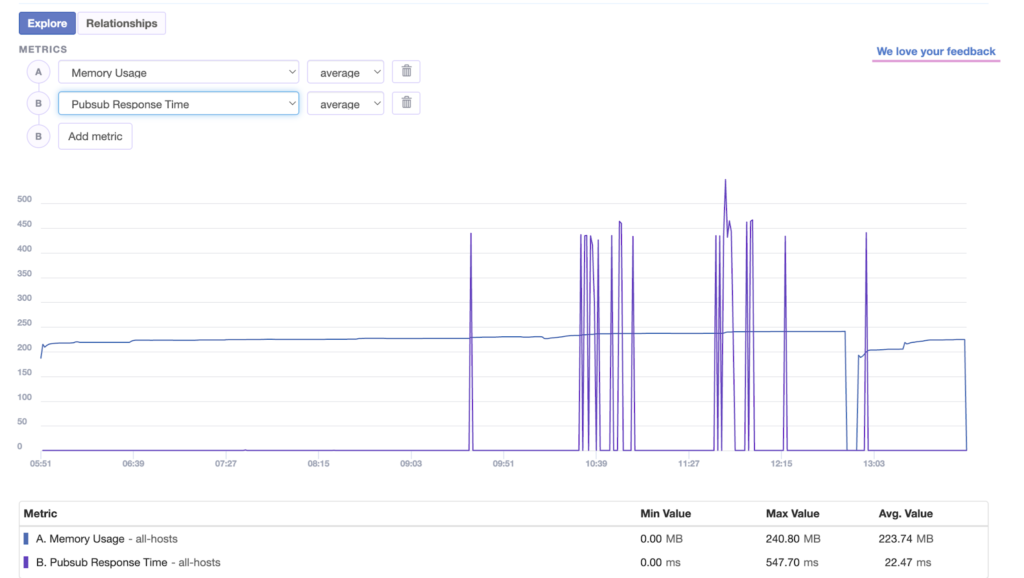
The GalaxyPlatform provides the necessary tools for tracing, logging and notifications for alerting out of the box when you deploy your app to the cloud. Here’s my app’s System Level metrics in the overview section of the app’s dashboard in Galaxy.
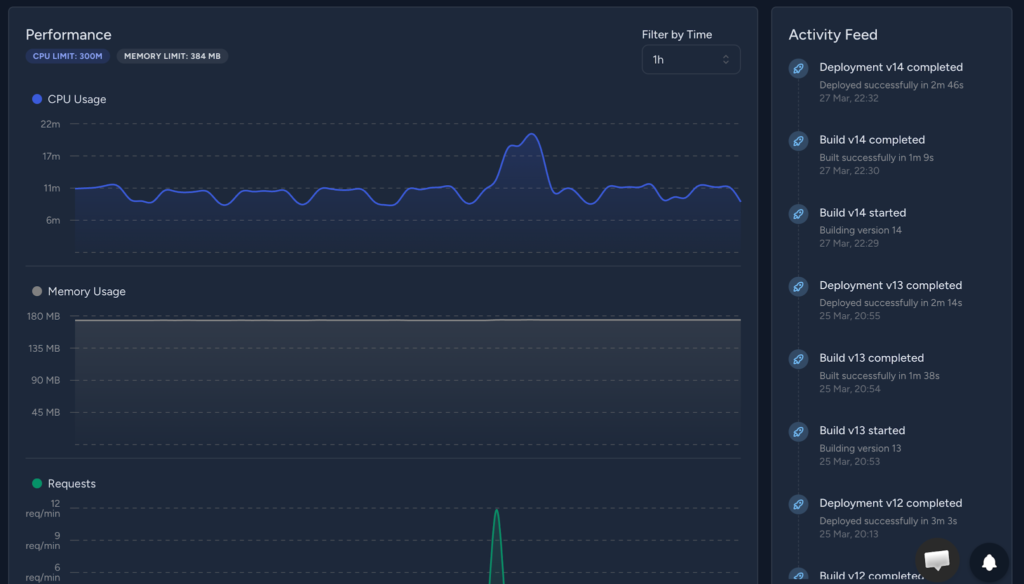
It clearly shows a historic trend of CPU and Memory usage of my app in a particular container, and from this, we can determine if any optimisation is required from our side in the app or to update the infra resources in the deployment environment.
If you want to deploy your Meteor app on Galaxy Cloud for free, you can check out this guide: Deploying Your First Meteor App to Galaxy: A Beginner’s Guide.
We can also understand the container’s health and if any modification is required for a particular container, which is very relevant for today’s multi-az deployment strategies.
Also on the right side, there’s an Activity Feed which shows your build and deployment activities. In a collaborative engineering environment, it’s vital to see which build version was triggered when, and what the latest pipeline update is.
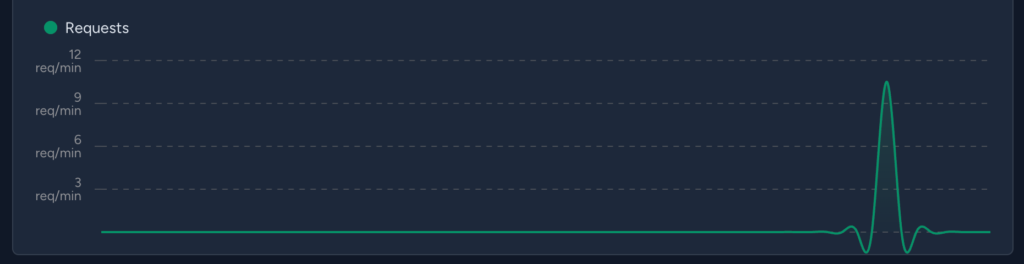
We can also see the request metrics for the app in the overview section.
The Logs section provides a convenient way to look into different logs throughout the application lifecycle, helping us with monitoring and troubleshooting.
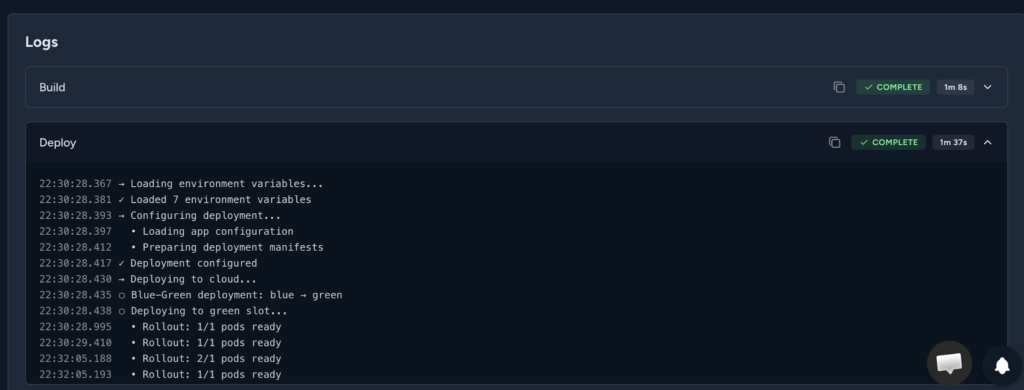
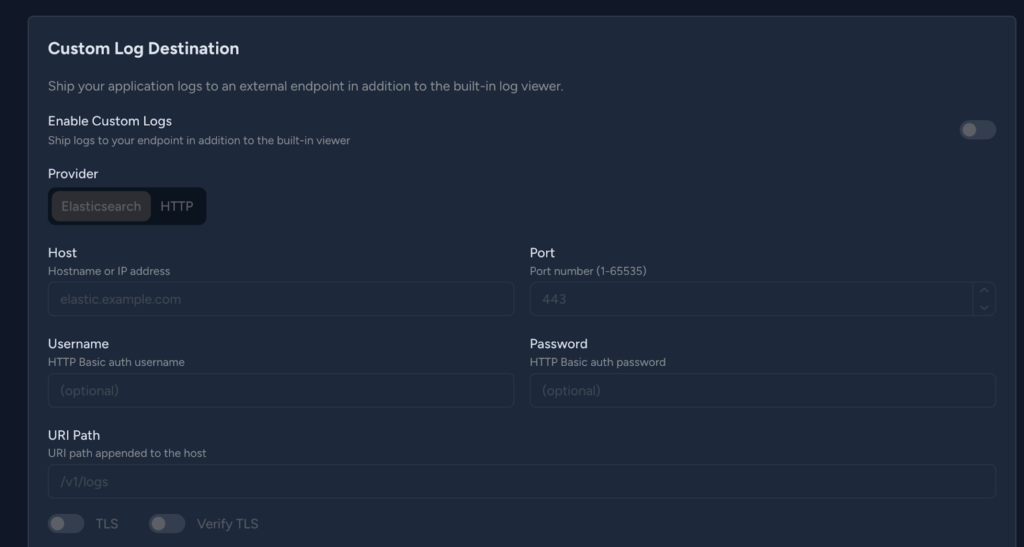
Many organisations have their own internal platforms for tracing logs ( e.g., we had Elasticsearch for this ), and to support that, Galaxy has out-of-the-box custom log destination settings where we can set log delivery to our services.
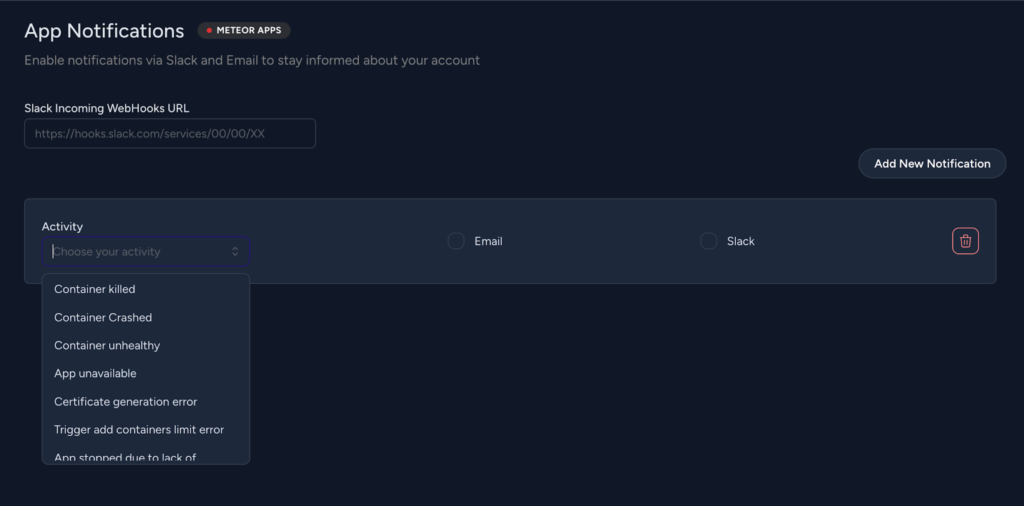
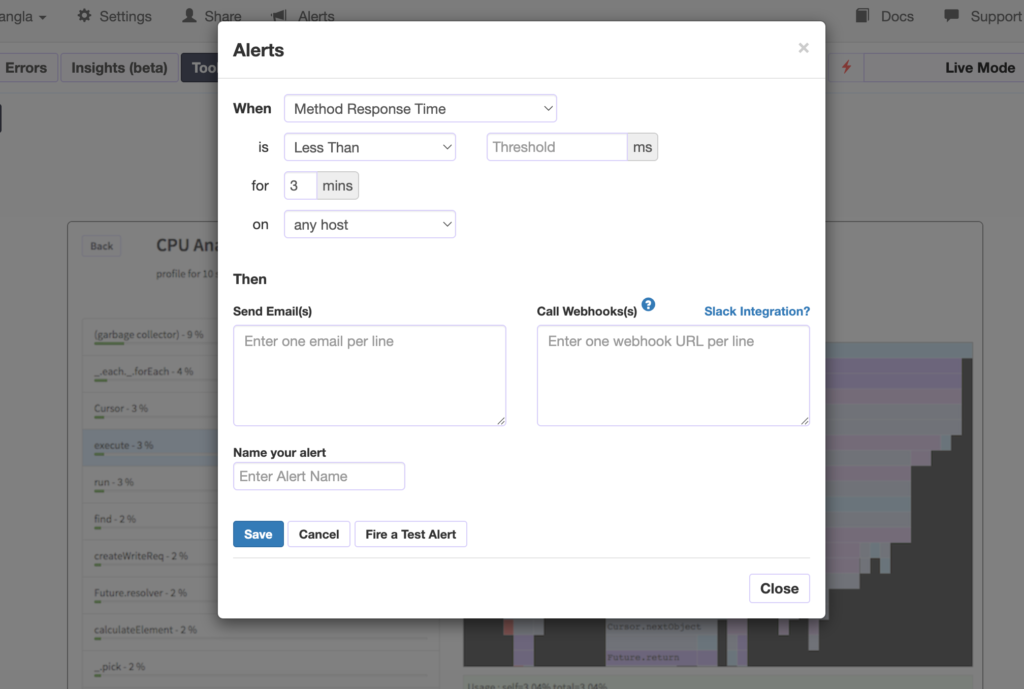
For container and build-specific alerts, we can use the App notifications feature of Galaxy, where it can notify via Slack or email in case of any chosen container/app/rescaling activity triggers.
Monitoring through Monti APM
Now, for more detailed monitoring, we can use Monti APM.
Monti APM is a monitoring tool designed for Meteor apps that helps you see how your system behaves in production. It tracks the performance of methods, publications, and HTTP routes while showing detailed traces of server activity.
Here are the steps for setting it up in a Meteor App –
- Install the monti apm package in the project, meteor add montiapm:agent.
- Now generate a Monti app ID and secret by logging into your Monti account and creating an app, https://app.montiapm.com/create-app
- Now, inside the app’s server-side code, just invoke the APM by adding – Monti.connect(‘<appId>’, ‘<appSecret>’)
- Monti APM agent can automatically connect when credentials are provided through Meteor.settings or environment variables, so you do not need to manually call Monti.connect in your code.
- Using Env Variables,
export MONTI_APP_ID=<appId>
export MONTI_APP_SECRET=<appSecret> - Inside the settings.json file,
"monti": {
   "appId": "<appId>",
   "appSecret": "<appSecret>",
   "options": {}
}
- Using Env Variables,
Also, for handling sensitive data such as secrets and credentials, you can refer to: A Practical Guide to Secrets Management for MeteorJS Apps.
Here’s my app’s Monti Dashboard,
You can detect slow operations, analyse CPU usage, and capture errors from both client and server. It also gives insight into Node internals and MongoDB performance, so you can debug issues quickly and keep your app stable.
It also provides visibility into Node internals, fibers, and MongoDB driver behaviour, so you can debug deeper issues without guesswork.
With built-in alerting, it ensures you stay informed when something starts going wrong so you can act fast and keep your app stable.
One can avail of Monti integration with Galaxy by opting for the Professional plan in Galaxy Cloud.
Using Sentry
Sentry is an error monitoring tool that helps you track and debug issues in your Meteor app across both client and server. It captures real-time exceptions, shows stack traces, and provides context like user actions and request data so you can quickly identify and fix bugs. With alerting and release tracking, it helps you stay aware of new errors and maintain app stability in production.
To set up Sentry, a meteor project below steps need to be followed,
- Create an account in Sentry and create an application to get the application DSN ( a app-specific code ), and it can be kept in the settings.json
- Now in the server directory, an instrument.ts file needs to be created with the below code,
import * as Sentry from '@sentry/node';
Sentry.init({
   dsn: process.env.SENTRY_DSN,
   sendDefaultPii: true,
}); - Import the file into the server’s main entry file at the top line.
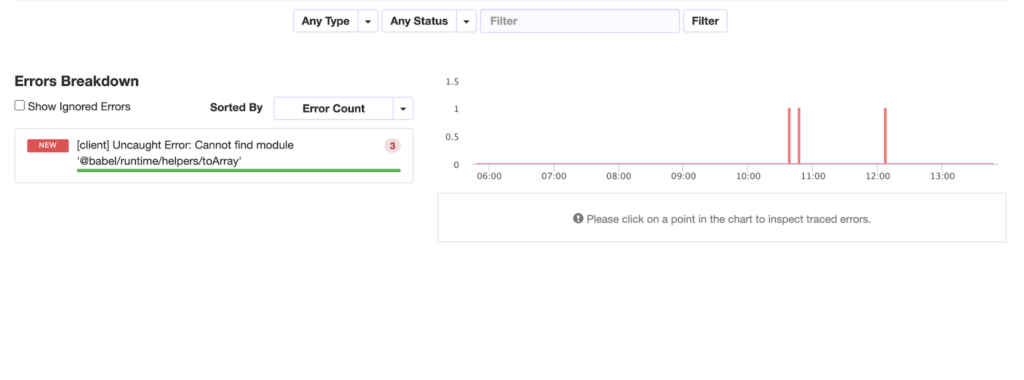
Here’s a screen from one of the errors of my meteor app in Sentry,
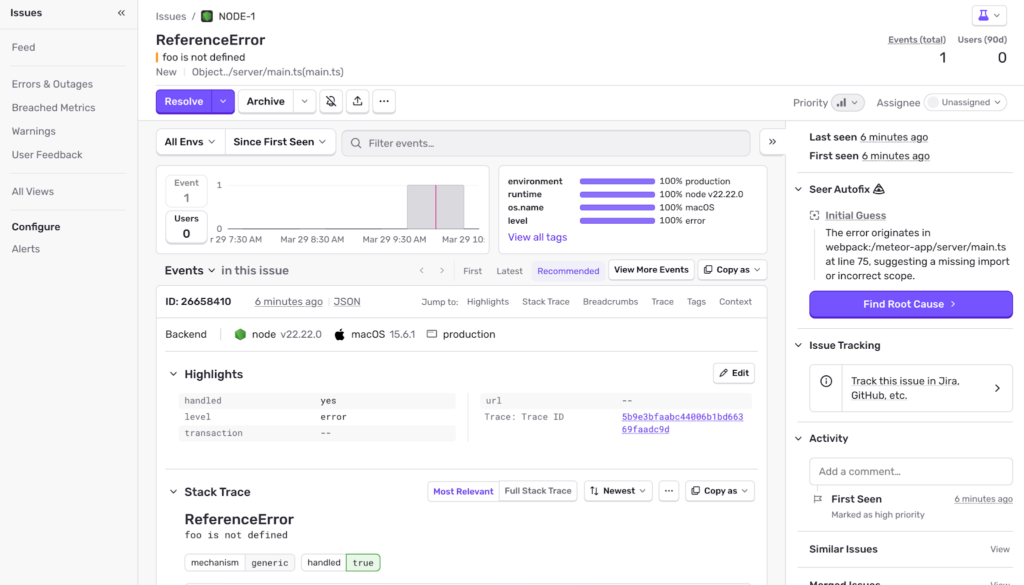
It provides a lot of details about the error, stack traces and tracability.
Using Uptime Robot for basic uptime monitoring
UptimeRobot is a simple uptime monitoring tool that checks if your Meteor app is accessible at regular intervals and alerts you when it goes down. It pings your endpoints, tracks downtime, and sends instant notifications via email, SMS, or integrations so you can respond quickly and keep your app available.
Here’s the uptime robot status page of my Meteor application,
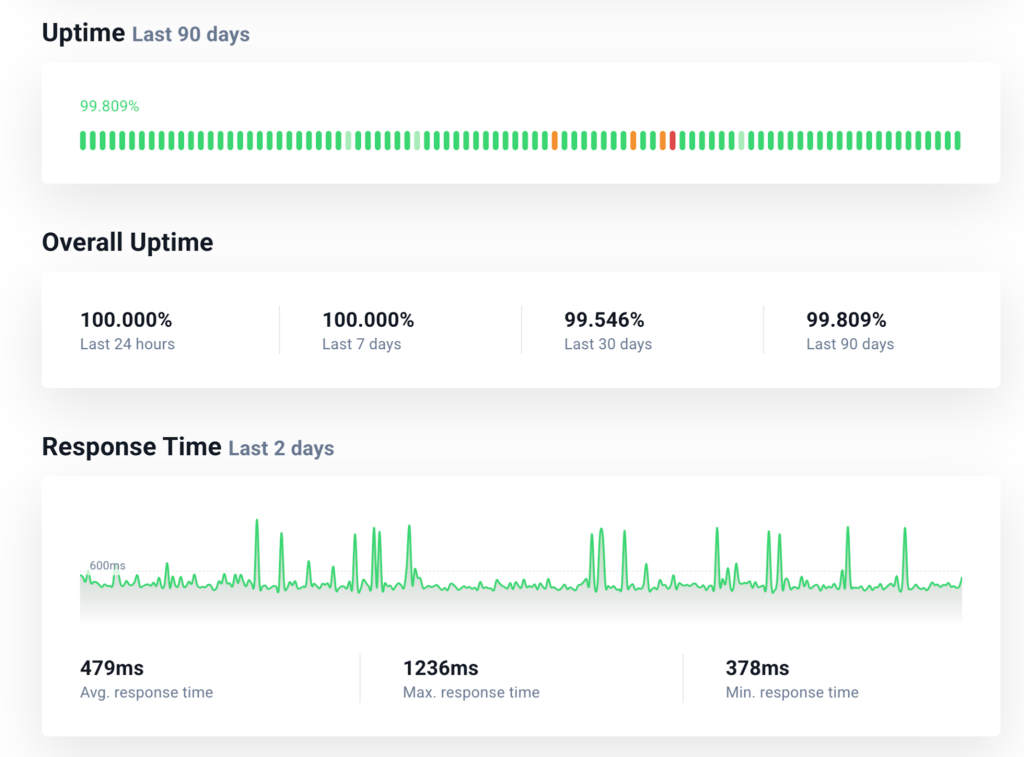
It keeps checking the health endpoint every 5minutes and sends me emails whenever the app goes down or comes up. With a very minimal setup its a very convenient way of knowing if any downtime happened.
Choosing the Right Mix of Monitoring Tools
When I set up monitoring for a Meteor app, I do not rely on a single tool. Meteor gives me flexibility, so I choose tools based on what I want to observe.
If I am using Galaxy, I start there. It gives me logs, basic metrics, and alerts with almost no setup. I can quickly see CPU usage, memory, and request patterns. This becomes my baseline.
When I need to understand performance inside the app, I use Monti APM. It shows me how publications and methods behave. If something feels slow and I cannot pinpoint the reason, Monti usually gives me that clarity.
For errors, I prefer Sentry. It captures exceptions with useful context and stack traces. This helps me debug issues faster and understand what users are facing. Though it can be optional since we get some error loggings in Monti as well.
As the system grows, I would consider Datadog. It helps me bring logs, metrics, and alerts into one place. This is useful when I have more services or need better visibility across the system.
In most cases, I mix these tools. I use Galaxy for system-level visibility, Monti for Meteor-specific performance, and Sentry for error tracking. I bring in Datadog when things start to scale.
I think of monitoring in simple layers. One tool shows me system health. One explains performance. One captures failures. Once I look at it this way, choosing the right setup becomes much easier.
Things to Avoid in Alerts
I have seen that alerting is where most teams struggle. Either too many alerts or no useful alerts.
Here’s how to do it right:
- Alert on symptoms, not noise
Focus on high error rates and latency instead of minor metric changes. - Define clear thresholds
Example: error rate above 5 per cent for 5 minutes. - Use severity levels
Critical alerts for downtime, warning alerts for performance degradation. - Route alerts properly
Send critical alerts to on-call engineers and notify low-priority alerts to Slack/communication channels. - Avoid alert fatigue
If everything is urgent, nothing is urgent.
Conclusion
In my experience, I have seen Monitoring and Alerting in Meteor Apps helping a small startup with 3 engineers to set up preventive measures in order to keep moving with speed without getting into unprecedented issues, wasting our biggest resource: time.
I have also seen in big enterprise-grade applications that it’s always about the user experience, hence timely monitoring and alerts help us to always keep our customer experience as a priority.
Monitoring becomes a habit. Teams that take it seriously ship faster and sleep better.
In the end, production systems will always surprise you. Monitoring and alerting give you the visibility to handle those surprises with confidence instead of panic.